![]()
![]()
![]()
Appendix - 1. Participatory rural appraisal tools that may be useful in an institutional analysis
Appendix - 2. Worksheet for evaluating operational rules governing resource use
Participatory Rural Appraisal (PRA) is a research/planning methodology in which a local community (with or without the assistance of outsiders) studies an issue that concerns the population, prioritizes problems, evaluates options for solving the problem(s) and comes up with a Community Action Plan to address the concerns that have been raised.
PRA is particularly concerned that the multiple perspectives that exist in any community are represented in the analysis and that the community itself takes the lead in evaluating its situation and finding solutions. Outsiders may participate as facilitators or in providing technical information but they should not 'take charge' of the process.
In PRA, a number of different tools are used to gather and analyse information. These tools encourage participation, make it easier for people to express their views and help to organize information in a way that makes it more useful and more accessible to the group that is trying to analyse a given situation. In this appendix, a number of tools are presented that might be useful in a PRA studying the institutional aspects of a community forestry activity. These are by no means the only tools that would be useful in such a study and those which are proposed here would have to be adapted to any particular situation. They are intended to give a sense of what information can be obtained by using different tools and how diverse issues can be looked at from multiple angles. In no case are these tools ends in themselves. Rather they will help to provoke discussion and bring up issues that can then be followed up in interviews (which will often take place around the diagram that has been produced) focusing on relevant institutional issues. The key, in other words, is not just to make a Venn (or some other) diagram but to use the diagram to probe further and ask questions about how decisions are made, -what happens in different conflictual situations, etc.
It is hoped that the presentation of these tools will help stimulate the facilitator's ideas about how to gather the kinds of information recommended by this manual and will help people who are already familiar with PRA to get an idea of how the participatory toolkit might be applied to these institutional issues. Readers who do not yet have experience with PRA but who are interested in applying it to an institutional analysis are encouraged to contact an experienced practitioner or consult the literature for more extensive information on the correct use of the methodology.
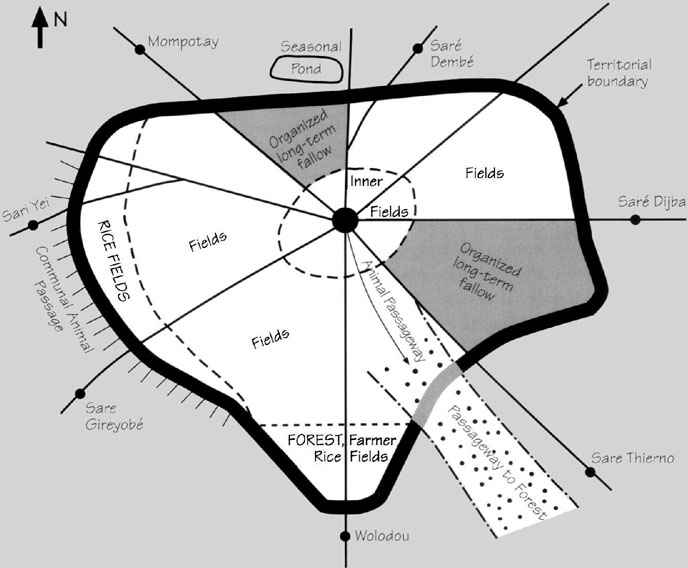
I. Participatory Mapping
In participatory mapping, community members sketch maps to elicit information and provoke discussion on spatial issues. The maps are not intended to provide accurate cartographic information but rather to generate approximate information that can be used to generate further discussion. Ideally the maps should be drawn on the ground in a large open area so that there is plenty of room to expand the scale of the drawing as the activity progresses. Various markers (leaves, stones, shells, etc.) can be used to indicate landmarks on the map. Maps are most useful when a group of people participates so that everyone contributes to the activity and information can be cross-checked by several sources. It is sometimes useful to do resource maps with different groups of people (one with men, one with women or others with different occupational groups such as farmers or pastoralists) to see how their perceptions of resource issues differ.
Figure 2: Example of a participatory map
When maps are used to gather information for an institutional analysis it will be especially useful to identify where critical resources and the principal user groups are located, who uses the various resources the sources of pressure on the resources resource sites that die subject to conflict, any physical barriers to resource use (such as fences) etc.
II. Transect Walk
A transect walk is a mobile interview in which the research team walks from the centre of the village to the outer limit of the territory accompanied by several local informants who are especially knowledgeable about natural resource issues Together the team members and the informants observe what happens in different micro-ecological niches and discuss issues of mutual interest. The walk need not follow a straight line; it may be more interesting to purposefully orient the walk to take in places of particular interest such as a sacred grove or private orchard. And the team members need not all follow the same path; it will probably be more useful to divide the team into smaller groups so that two to three people can go off in one direction while another group takes a different route. This permits the team to cover more ground and gather more perspectives. It is useful to look for signs that resources are being used (cut branches, children or adults collecting fruits) or that there are controls on resources (e.g. fences, thorn pickets around trees, amulets hung on resources). The key is to take the opportunity to ask questions about resources and how they are used while actually observing the situation in question. Later the information can be organized into a table such as the one on page 123. Transects can be helpful in focusing on such issues as where resources are located, how and by whom they are used, how much pressure exists on various resources, what the rules of access are and whether there are conflicts.
Table 4: Example of information gathered in a transect walk
|
TRANSECT |
|||||
|
ZONE |
FOREST |
FAR FIELDS |
NEAR FIELDS |
INHABITED VILLAGE |
RIVER/BANKS |
|
OCCUPATION OF SPACE |
Trees, charcoal kilns, sacred grove in part of forest, animal passageway to ponds |
Men's fields, pasture during dry season |
Women's fields, granaries, mil let pounding areas Fields are well manured and fenced |
Houses, stables, wells, infrastructure (school shop, and health facility) |
Fishing, washing, laundry |
|
TREES |
Dense trees, more than 50 species |
Sparse trees, dominated by 5 species, some trees fenced |
Many trees, mostly fruit trees |
Many trees, mostly fruit and shade trees |
Mangroves |
|
TENURE OBSERVATIONS |
Strict rules concerning sacred forest, rest of forest is open access for harvesting tree products No trees may be cut without permission of forestry agent (charcoal makers are supposed to have permit) |
Fields are privately held during rainy season and access to all resources is controlled Becomes open access to village residents during dry sea son, others must ask permission All fenced trees require owner's permission to harvest |
Rules of access and use are very strict in near fields Women have permanent rights to these fields that are transmitted from mother to daughter Access to all trees is forbidden without permission of holder |
Village has recently been 'squared off' by the authorities and many conflicts have resulted since people lost trees that they had planted before the new parcels were allocated |
Fishing rights are carefully controlled; catch limits are imposed by committee of fishermen. Other uses of river and banks are open access to residents and non-residents. Degeneration of mangrove swamp due to excessive cutting for fires for fish drying. |
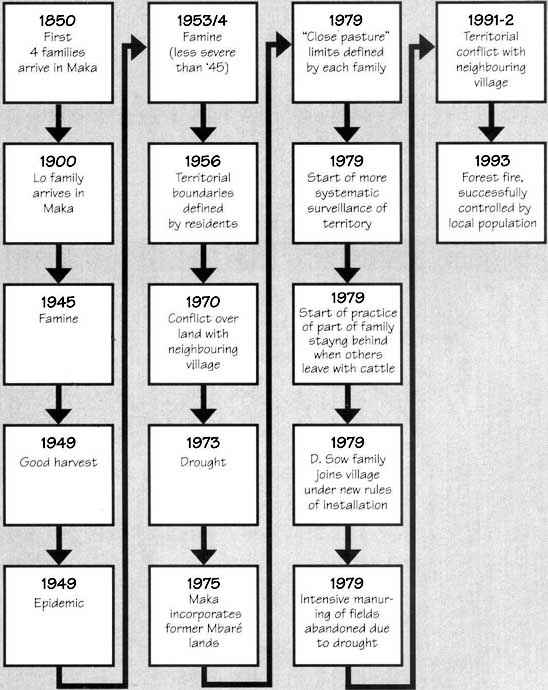
III. Historical Profile
A historical profile is an interview with several of the people in the village who are most knowledgeable about its history. Because historical information can often be confusing to the outsider, and even at times to local people who are less versed in the details than the elderly village historians, it helps to organize the information on cards or bits of paper as it is presented. As each event is mentioned it can be noted on the card with at least an approximate date or time period (e.g. late nineteenth century, 1940s). The card is then put down on the ground. When another event is cited the interviewer asks (if it is not obvious) whether it was before or after the previous event and attempts to get an approximate date or time period. In this way each event is represented by a card that is put in its approximate chronological order.
The historical profile is most useful when it focuses on issues about resource governance such as the settlement history of the community (who came when), periods of abundance and scarcity, landmark events such as the building of roads and bridges and notable conflicts in village history (especially those related to resource use).
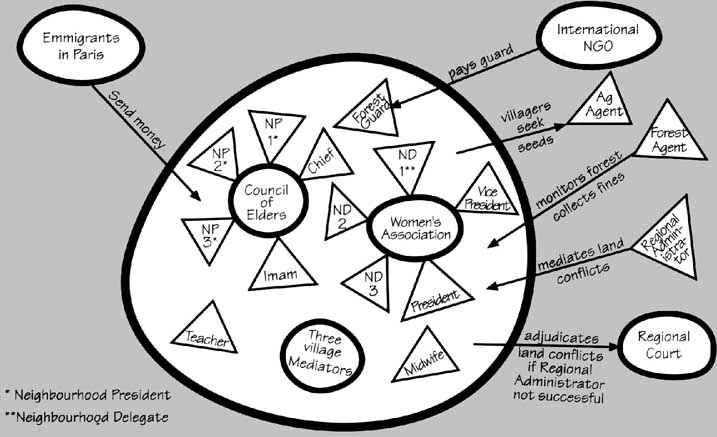
IV. Venn Diagram
The Venn diagram, also known as a Chapati diagram, is a map of a community's social structure. A Venn diagram can be done on a large sheet of paper or a chalkboard. It is helpful to have pieces of paper (of different colours, if possible) that are cut into different shapes to represent the various organizations and individuals in a community. These are then taped to the diagram. If coloured paper is not available the groups and individuals can be drawn on the paper with a marker. The activity can also be done on the ground using stones of different sizes to represent various groups.
Figure 3: Example of a historical profile
To begin, a large circle is drawn on the paper to represent the village where the institutional analysis is taking place. Everything inside the circle will be a committee or person in the village; all markers placed outside represent external organizations or individuals who have an impact on resource governance or the villagers' use of resources. Begin by asking the group to think about all the organizations, committees, groups, societies, etc., in the village. List each one on a piece of paper (a circle, perhaps) and affix it to the large paper inside the circle representing the village. Continue with individual villagers who play a particular role in the community, especially those who have any particular function in resource governance or conflict resolution. These individuals can be represented by triangles.
Figure 4: Example of a Venn diagram
When all the village organizations and individuals have been put on the diagram, continue by asking about organizations and individuals outside the village who have some impact on resource governance or use. This might include government officials, development workers, commercial firms, etc. Place a shape for each individual (triangle) or group (circle) on the diagram, outside the circle that represents the village.
Once the diagram is complete, take the opportunity to explore institutional issues in greater depth by finding out who makes what decisions, how decisions are made, how leaders gain their authority, how conflicts are resolved, etc.
V. Wealth Ranking
Wealth ranking is a tool that helps to better understand socio-economic differences within a community. It can be used to explore differences in how various populations use resources and their role in governance. The key to wealth ranking is that it does not ask about any individual's wealth, but rather assigns families (anonymously) to different groups in the village that are then ranked according to their relative wealth. It is then possible to ask about how these groups use resources, participate in governance, etc.
There are several different ways to do wealth ranking. The simplest may be a 'bean ranking'. The facilitator begins by discussing the concept of 'wealth' with the group that will be doing the wealth ranking. The idea is to get an understanding of how people define the term locally. Then the facilitator takes a pile of beans or pebbles and explains that the pile represents the population of the village, asking the group to divide the pile into subgroups whereby each pile of stones represents a group of families having approximately the same level of wealth. It is up to the informant to decide how many piles are appropriate for this particular village: three piles for richer/average/poorer? Four piles for richer/average/poorer/very poor? The size of the pile should indicate, proportionally, how many families are found in that group. If there are many families there will be many beans in the subgroup; if there are few families there will be just a few beans in the pile.
Once the piles have been divided, the facilitator asks the group to discuss each pile in turn. What does the 'wealthiest' group have that the others do not have? What about the second group? The third? And so on. Once the piles and their characteristics are clear, the facilitator may take the opportunity to conduct an interview about institutional issues that are related to socio-economic differences. Do the decision-makers in the village all come from a certain wealth strata? Do all groups have an equal weight in decision-making? Do they all have the same access to resources? Do they use the resources in the same way? And so on.
While the wealth ranking should avoid discussing personal wealth or individual families in the community, it is useful to follow up a wealth ranking with interviews and discussions with people in different wealth classes to understand the different issues they face, Having done the wealth ranking and thought about issues of wealth and resource use the community may decide that it wants to explore these issues further. In this case it will have to decide on a culturally appropriate mechanism for selecting families to he interviewed further. Alternatively it may choose to use the matrix suggested below to explore these issues more systematically.
VI. Matrices
A matrix is a double entry grid that can lie used to analyze two sets of variables. There are many ways that matrices can be used to explore institutional issues. Three examples will be given below in order to give an idea of a matrix's flexibility. Each study team will want to devise its own matrices to explore the issues that are most important in a particular site.
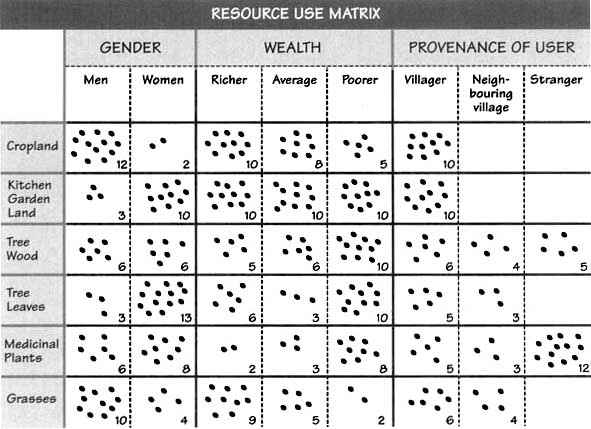
1. Resource Use Matrix
A resource use matrix reliving again on beans to indicate rankings can be used to identity the principal users stakeholders of various resources and to explore how these groups use the resources and their importance. The various resources exploiter in tile community are placed along the vertical axis. Different factors that might affect resource use are grouped along the horizontal axis (e.g. gender wealth insider outsider). The activity begins by comparing the resource use patterns of the users in the first column (men vs. women). Starting with the first resource (cropland in this example), compare whether men or women use the resource more. The groups will put from 1 to 10 beans in each box to indicate the relative importance of the resource to each group. Continue with the next resource until the entire gender column has been completed. Then continue with the wealth column, comparing the use of resources by richer average and poorer people and so on.
It is important to follow up the matrix with an interview that goes into greater depth about why use patterns differ how access rules affect different populations what conflicts arise among various groups, etc. One must also be careful in defining the term 'use' so that all agree on a common meaning: is it the person who actually harvests the resource, or is it the end user?
2. Conflict Matrix
A conflict matrix permits the exploration of issues related to conflicts and how they are dealt with in a community. One way to set up a conflict matrix is to put the resources that might cause conflicts on the vertical axis. On the horizontal axis place the different groups that might be involved in conflicts. Decide at this point whether the matrix will show the frequency of conflicts or whether the number of beans will reflect the severity of the conflicts. Be sure that everybody understands what is being ranked before the counters are placed in each square. In this matrix it makes more sense to complete the analysis horizontally; that is, ask first about all the conflicts concerning trees in the village. Are there many or few conflicts concerning trees within the family? What about among villagers? With neighbouring villages? and so on. As the beans are placed in each square ask what the nature of the conflicts are. When the first row is completed, move to the second row and ask the same question about pasture land. When the entire matrix has been completed seize the occasion to ask more questions about conflicts and institutional issues. How are various types of conflicts resolved? What are the procedures? When do the various conflicts take place and what causes them? and so on.
Table 5: Example of a resource use matrix
Table 6: Example of a conflict matrix.
|
|
CONFLICT MATRIX |
||||
|
Within the household |
Within the village |
With neighbouring villages |
With strangers |
With the state |
|
|
Trees |
|
|
|
|
|
|
Pastures |
|
|
|
|
|
|
Cropland |
|
|
|
|
|
|
Water |
|
|
|
|
|
3. Historical Matrix
In a historical matrix, the horizontal axis is time, usually covering the period from when the oldest residents of the village were young (about 50-60 years ago) until the present. It is best to choose three or four time periods that will be illustrative of how things have changed in the community. Each time period should be represented by a landmark date that people can use to focus their memories on the period.
The vertical axis should include variables that are relevant to the institutional analysis. It may include such variables as how much land is in production, how dense the trees were in the community forest and how many species of trees were found in the territory. It may also attempt to examine issues such as the number of conflicts over resources. The idea is to look at major trends and then, in the interview that follows, to try to understand the causes and consequences of changes that have occurred over time.
People seem to find it easiest to complete the historical matrices vertically, that is, beginning with the earliest time period. One can ask the group to 'take a picture' of what things were like in the village at that time and then to place beans in the column to indicate whether the population was relatively large (more beans) or small (fewer beans). Then go on to the land under cultivation: were large areas of land cultivated (more beans) or was only a small part of the territory under cultivation (fewer beans)? When the first column is completed advance to the second column, working through each variable by comparing it to the number of beans put down in the first column. "At the time of independence was the population more or less than it was 60 years ago?" Ask the group to place beans to show whether the population grew or diminished and then continue working down the column in the same fashion.
Table 7: Example of a historical matrix
|
|
HISTORICAL MATRIX |
|||
|
When the elders were children (circa 1935) |
Year of independence (1960) |
Year the school was built (1975) |
Present |
|
|
Population of the village |
|
|
|
|
|
Amount of territory under cultivation |
|
|
|
|
|
Size of trees in community forest |
|
|
|
|
|
Density of trees in community forest |
|
|
|
|
|
Biological diversity of trees in community forest |
|
|
|
|
|
Frequency of conflicts over national resources |
|
|
|
|
|
Intensity of state intervention on community resource issues |
|
|
|
|
Operational Rules Governing
|
Rule |
Source of Rule |
Working/Non-working |
Sanctions/Other Observations |
|
|
|
|
|
|
|
|
|
|
|
|
|
|
|
|
|
|
|
|
|
|
|
|
|
|
|
|
|
|
|
|
|
|
|
|
|
|
|
|
|
|
|
|
|
|
|
|
|
|
|
|
|
|
|
|
|
|
|
|
|
|
|
|
|
|
|
|
|
|
|
|
|
|
|
|
|
|
|
|
|
|
|
|
|
![]()
![]()
![]()